Quantifying sexual transmission of Zika
Analyzing Zika virus survival in sexual contact networks
Zika virus (ZIKV) is predominantly vector-borne and the outbreaks are strongly dependent on the mosquito vectors. There have been evidence and reports of sexual transmission as well for ZIKV. To enhance our understanding on how the interactions of these transmission mechanisms can help sustain the virus during vector free winter seasons, we developed a novel epidemic model that interconnects homogeneous mosquito vector population with heterogeneous sexual contact network.
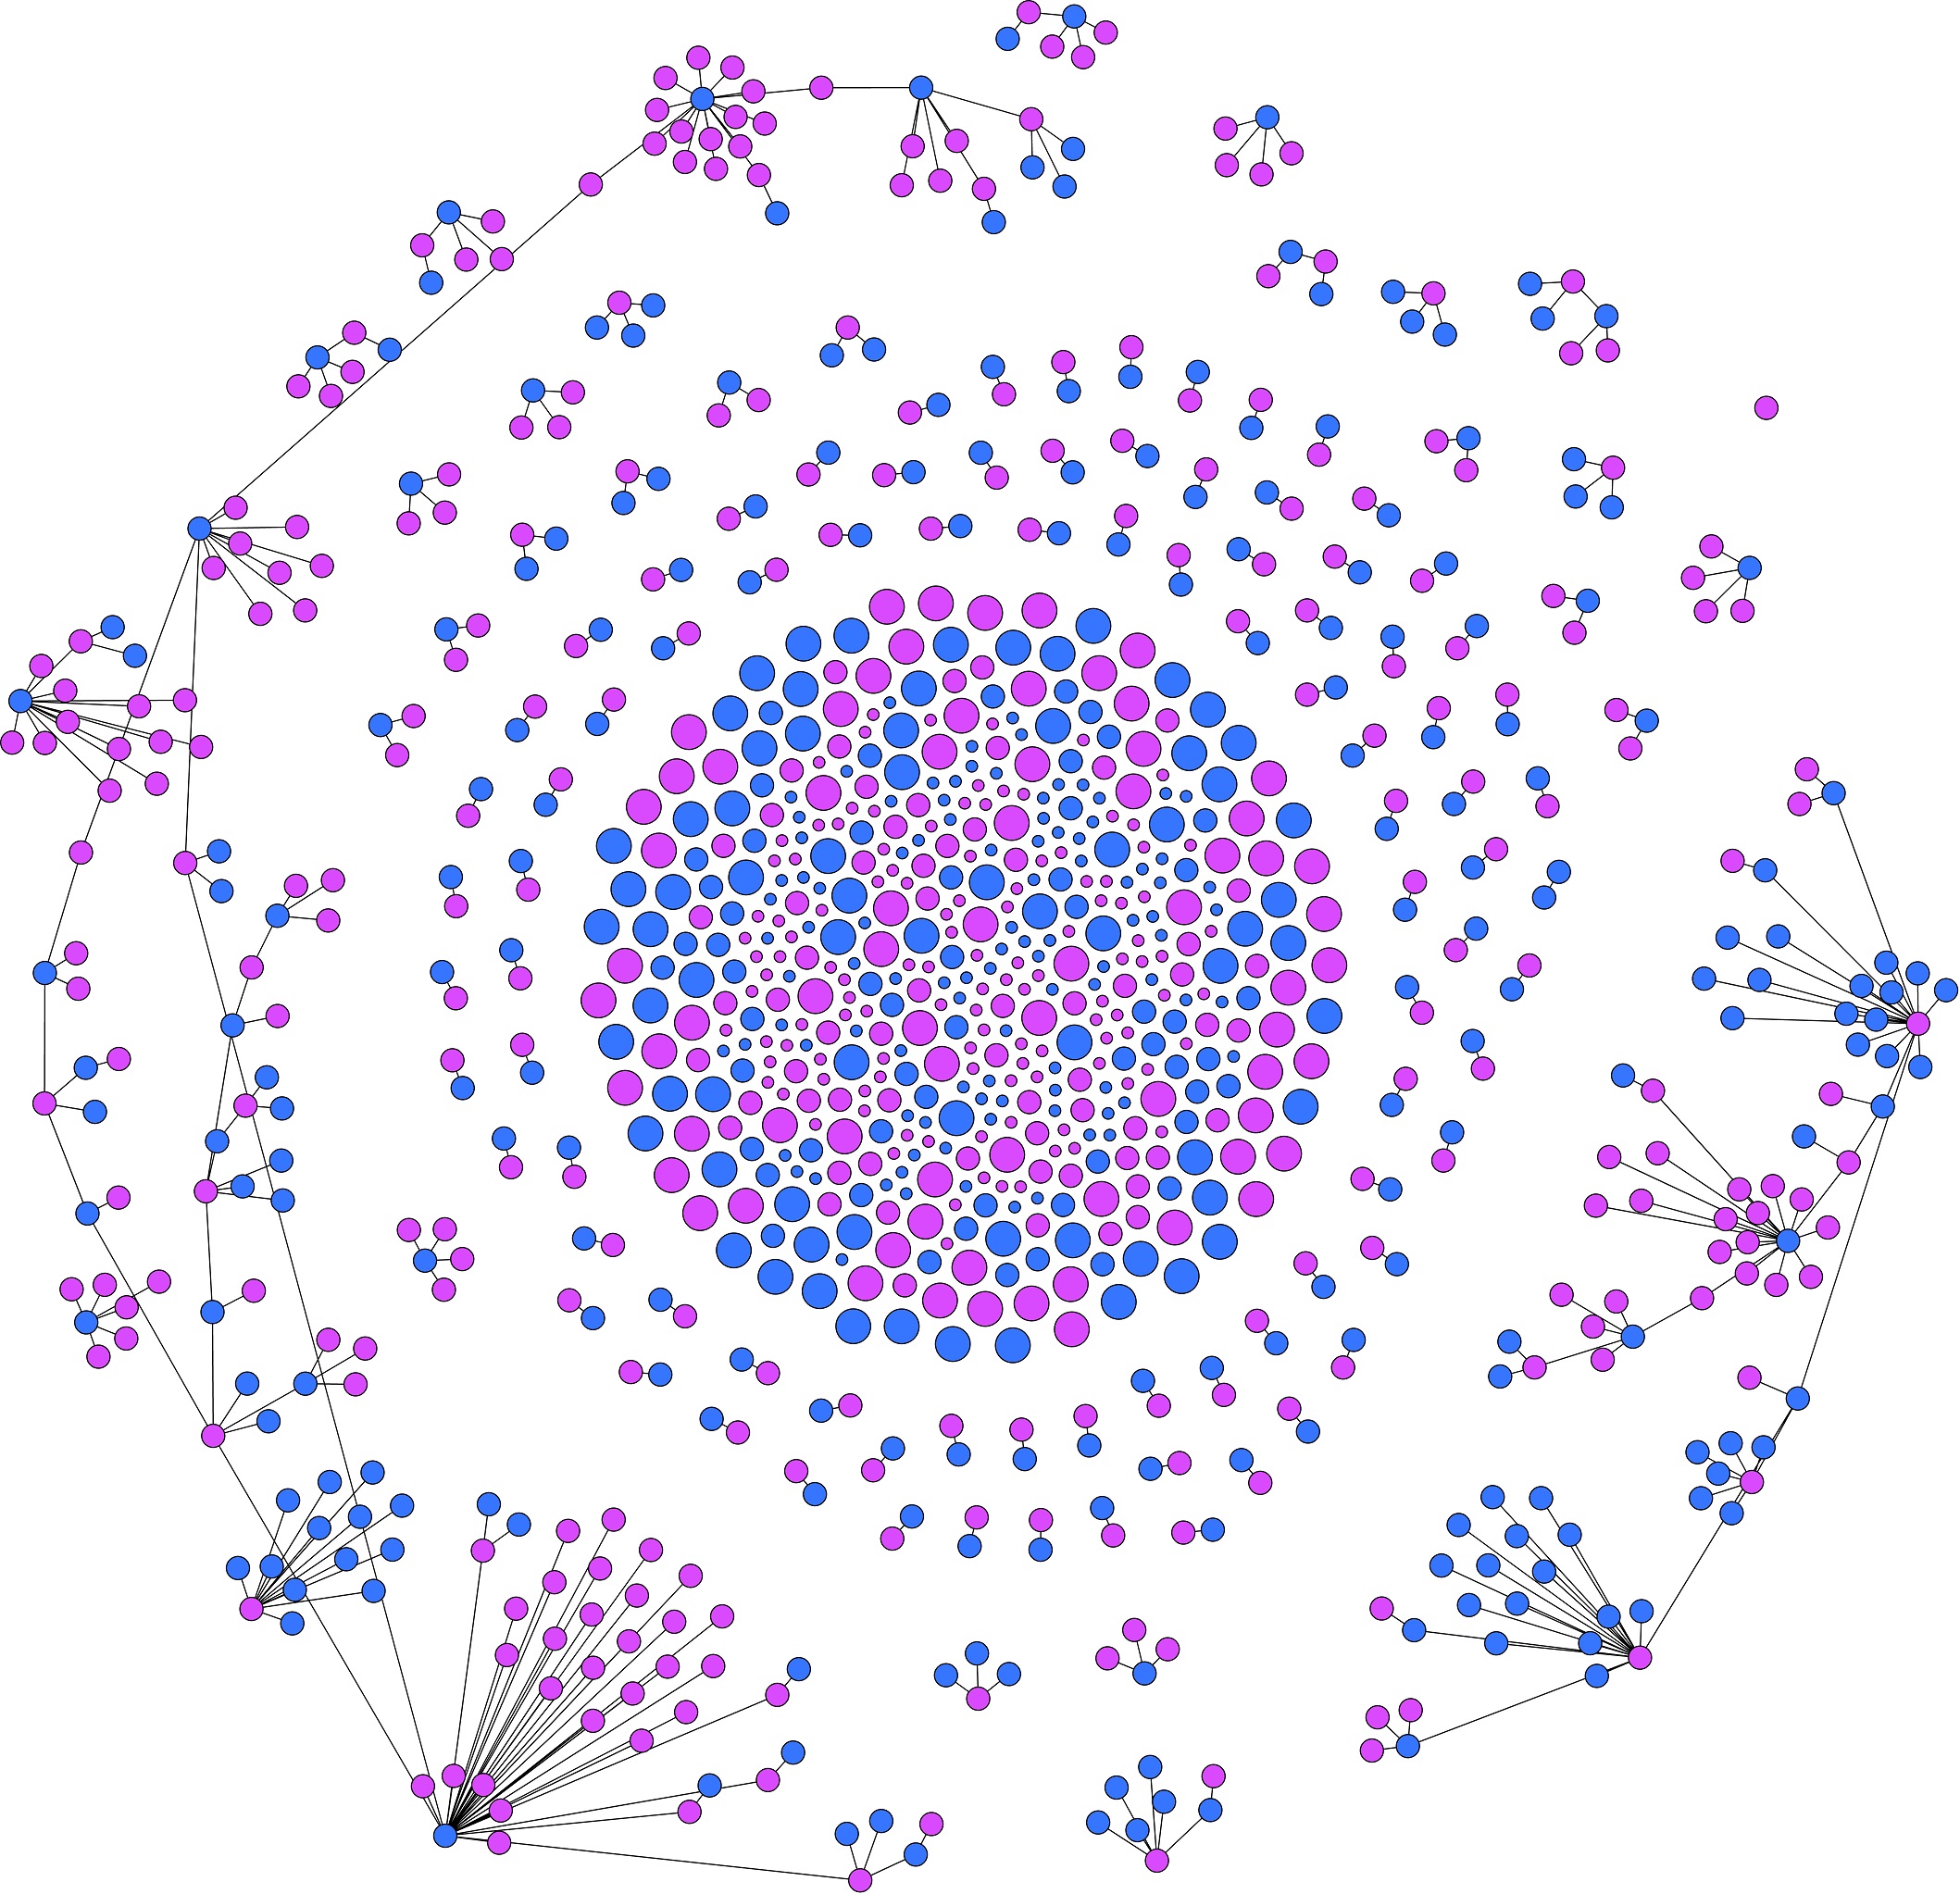
As a part of this work, we develop a graph generation tool based on the configuration model. The tools takes data on demography, sexual behavior patterns etc. as input and generates random graphs whose statistical properties match those data.

We also develop an individual-based network model and interconnect it with vector population. We incorporate heterogeneity of the host population but avoid unnecessary computational overhead by considering the vector population as a traditional compartmental model. Our model also differentiate between symptomatic and asymptomatic hosts and consider the extended sexual transmissibility (convalescence) of the recovering hosts. The sexual transmission within the host population is also dependent on gender, sexual orientation, and age. The vector sub-model incorporates seasonal climatic variations. A diagram of the model is given in the following figure.

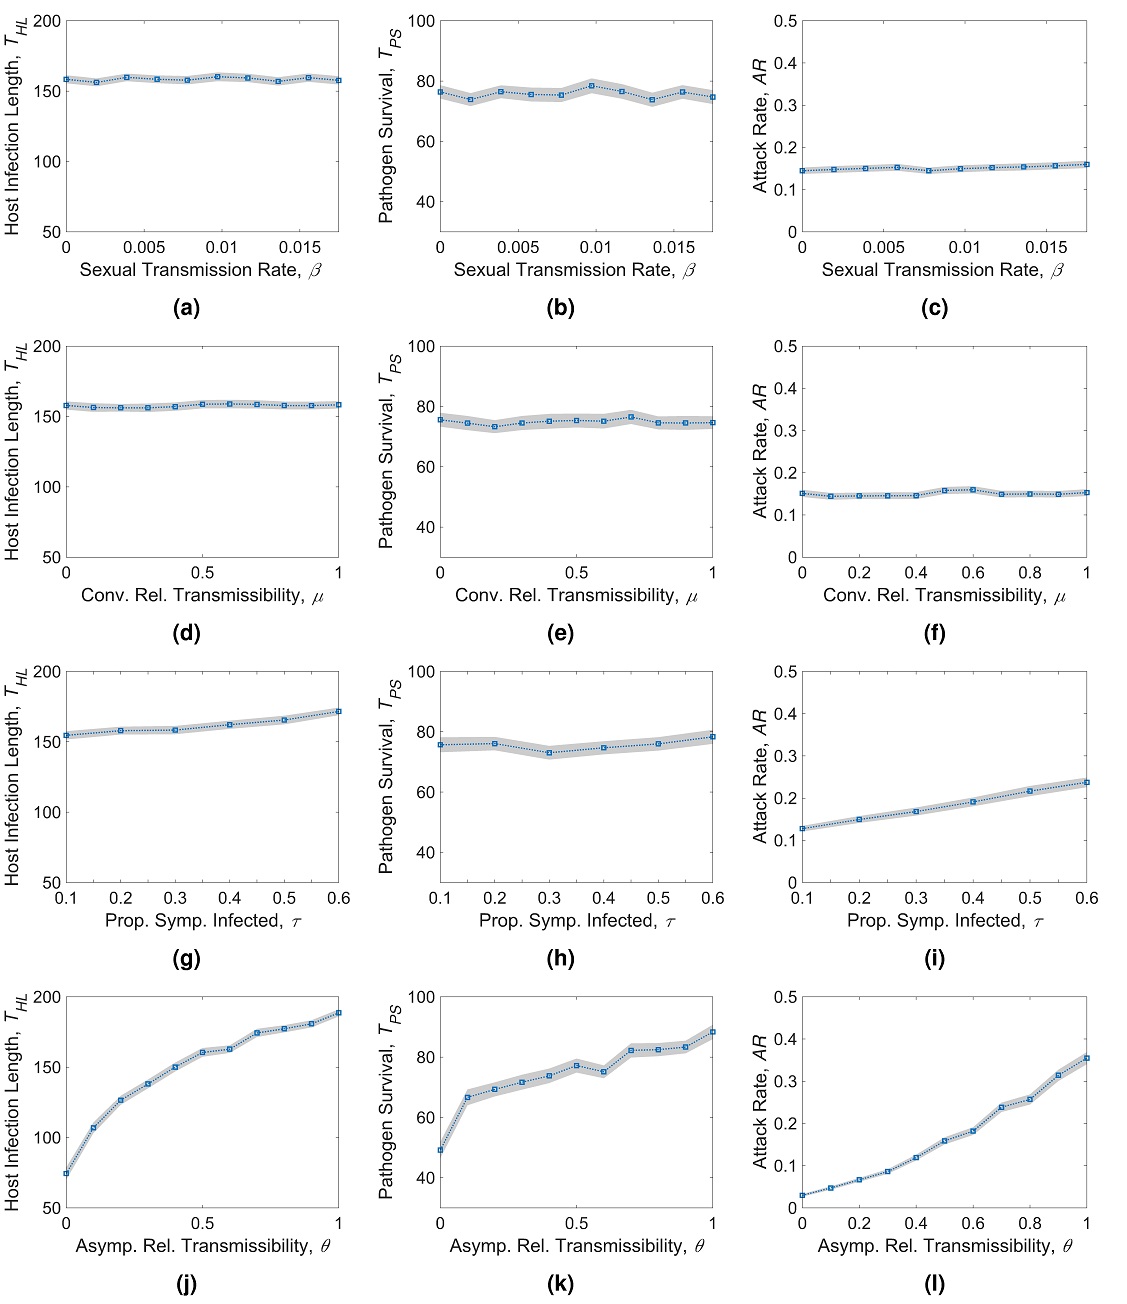
The simulation results suggest that for a high relative transmissibility of the asymptomatic hosts, Zika virus shows a high probability of sustaining in the human population, which can be up to 3 months without the presence of mosquito vectors. We also find that the outbreaks are strongly affected by the proportion of asymptomatic hosts and the time of the year when the pathogen is introduced in the population. Although sexual transmission has a relatively minor contribution in the outbreak size, it plays a role in prolonging the outbreaks and may create endemic scenarios.

| Publication | Source Code | Official Project Page |
|---|---|---|
| Scientific Reports | GitHub | K-State NetSE |