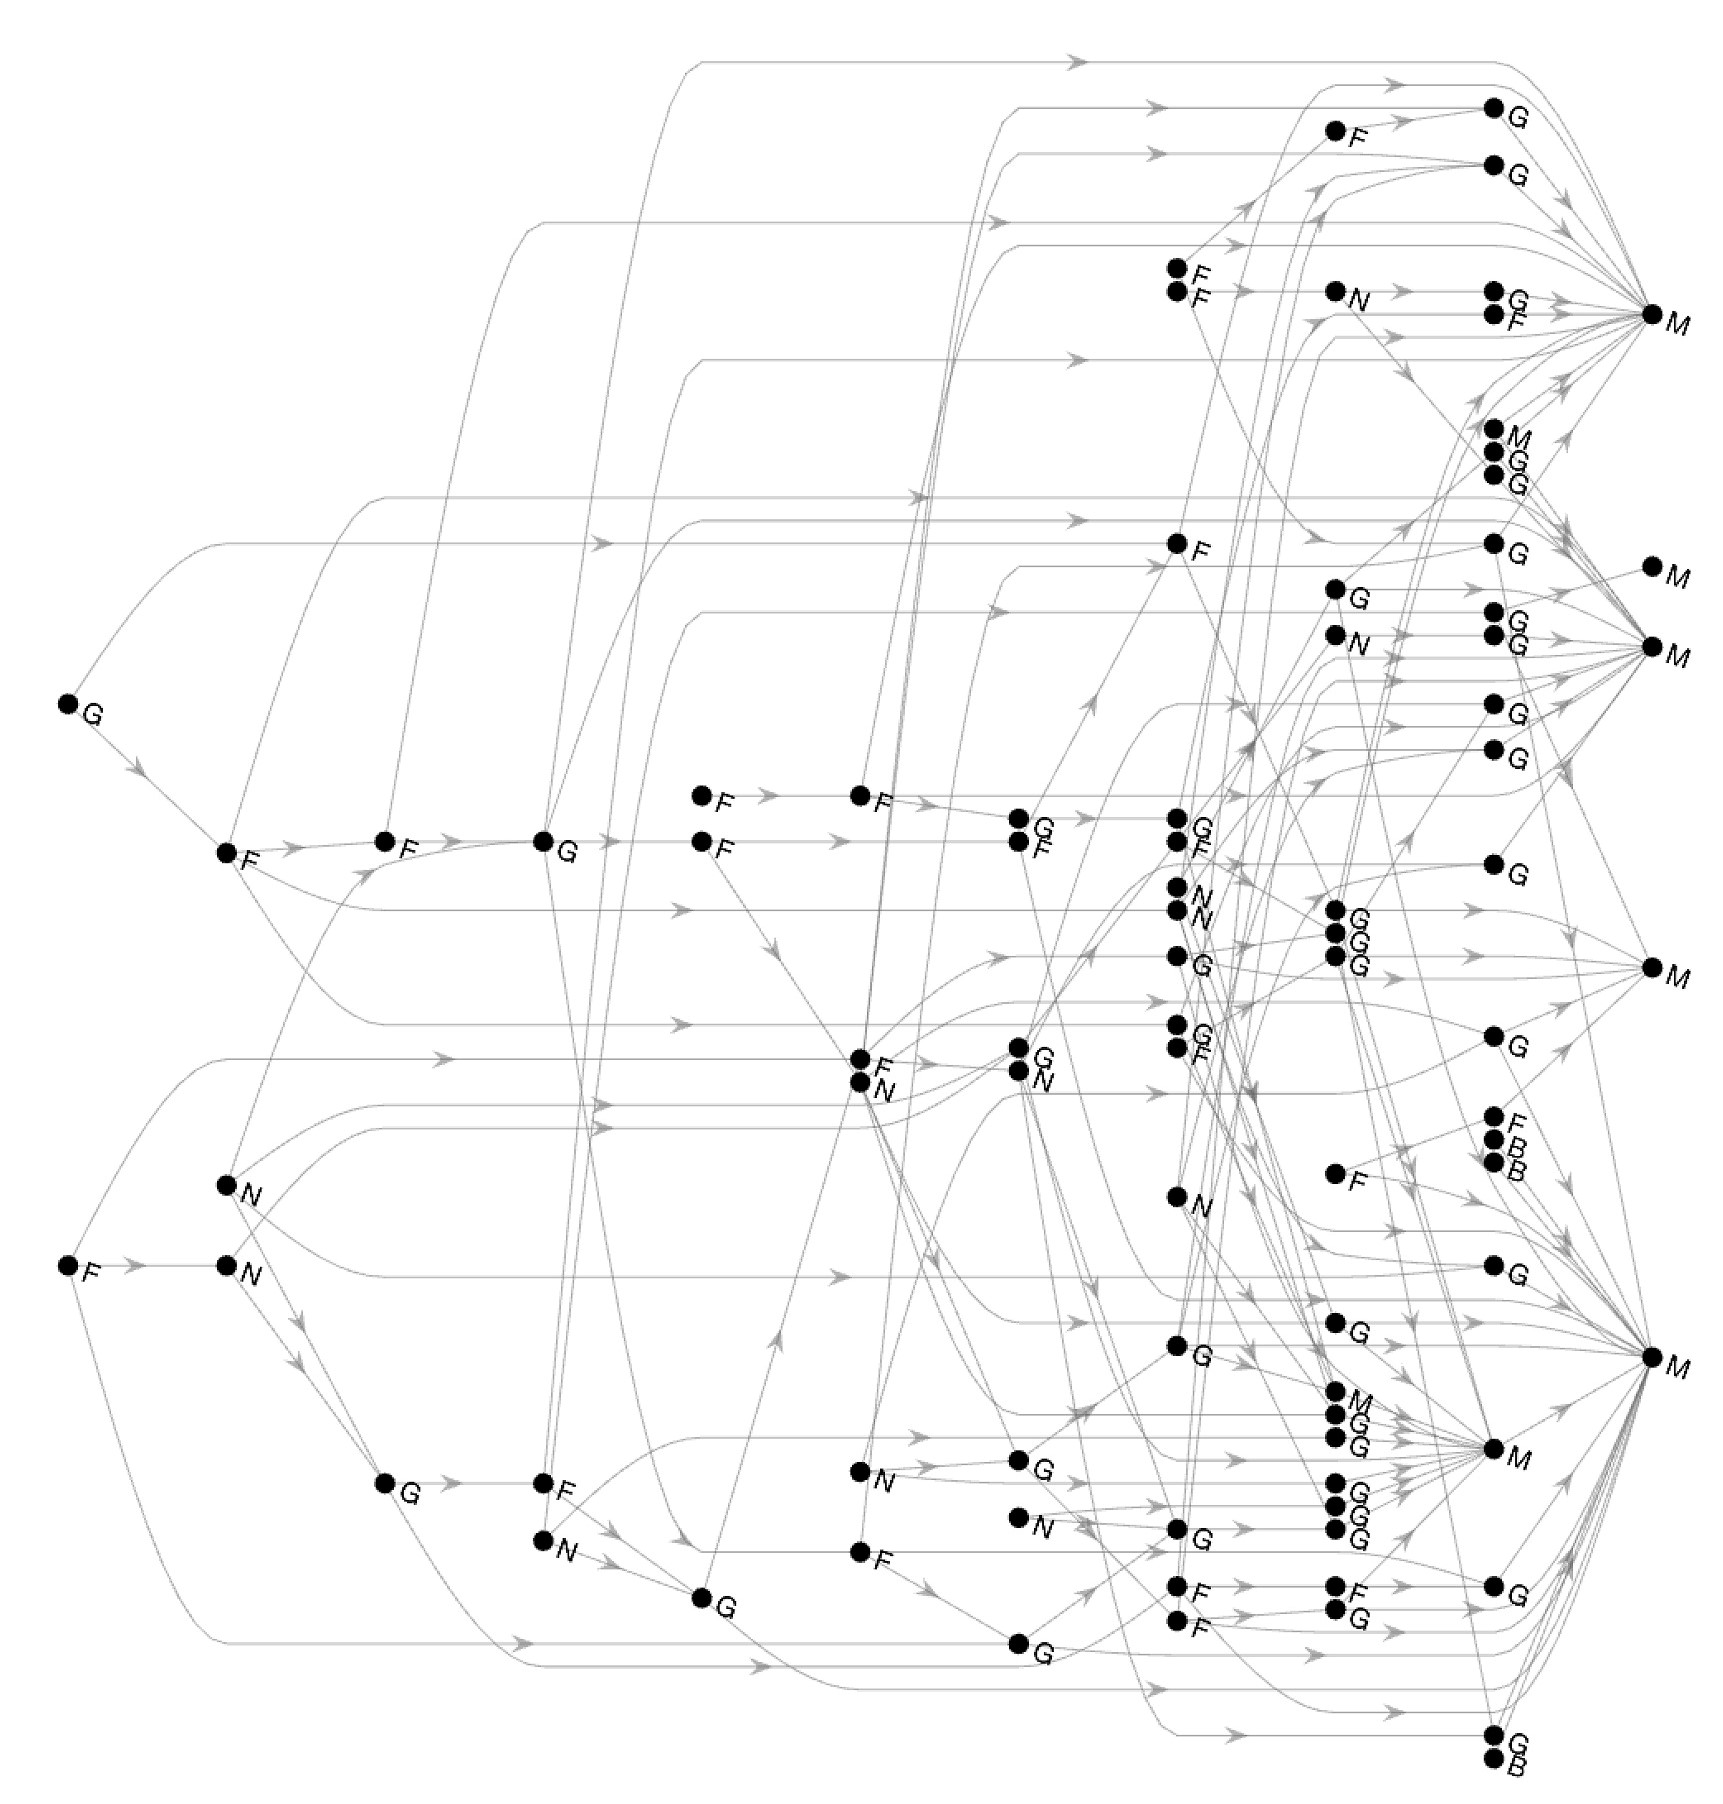
Generating swine movement network
Generation of swine movement network and simulating the spread of African swine fever virus (ASFV)
Animal movement networks are important to model disease outbreaks and identify the pathways of disease spread. In the US, pig farm data including herd sizes, geolocations, and movements between farms are difficult to obtain due to the sensitive nature of data and potential economic risk of making such information public. We propose a method to generate movement networks from limited data available in the public domain. Using the generated network from our method, we simulate the spread of African swine fever virus (ASFV) and analyze how the network structure affects the disease spread.

We find that high in-degree farm operations play critical roles in spreading the disease. Targeted isolation of those operations can efficiently contain outbreaks as indicated by the figure below.

| Publication | Source Code | Official Project Page |
|---|---|---|
| PLOS ONE | GitHub | K-State NetSE |